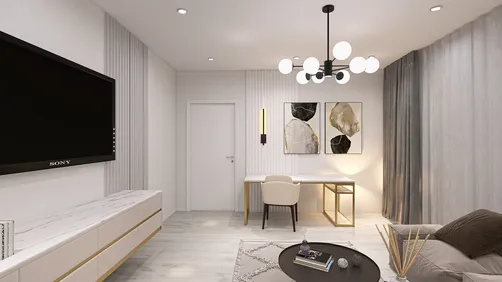
Many people wonder how to measure a room's temperature remotely without physical presence or elaborate installations. The concise answer is that it's possible to gauge or confirm it using smart sensors, HVAC systems, and environmental proxies. For a more in-depth explanation, accuracy hinges on proper placement, calibration, and a solid grasp of human comfort standards. Utilizing tools like Homestyler can also aid in visualizing and optimizing room layouts for better temperature management.
Comfort transcends mere numerical values. According to WELL v2 standards, the ideal thermal comfort range is generally between 20–24°C (68–75°F), contingent on clothing and activity, and it emphasizes the significance of factors like air speed, humidity, and radiant temperature in perceived comfort. Research from Steelcase indicates that thermal dissatisfaction is a prevalent issue in workplaces, showing that temperature discomfort can detrimentally affect performance and concentration. These findings are crucial when evaluating online temperature readings and determining whether to adjust your HVAC settings or simply modify airflow.
From a usability standpoint, the Interaction Design Foundation highlights that clear feedback and reliable data context can significantly reduce cognitive friction. When checking temperature online, focus on user-friendly dashboards, historical trends, and alerts instead of just raw numbers—context fosters better decision-making and minimizes errors.
Understanding How Online Room Temperature Monitoring Functions
The process primarily involves three methods: (1) smart thermostats or sensors that deliver real-time data, (2) building management systems (BMS) and HVAC portals, and (3) indirect techniques like using webcams alongside thermal estimation tools or user-initiated inputs. Direct sensing yields the most reliable results. If utilizing a smart thermostat or Wi-Fi sensor, ensure it accurately captures ambient temperature at occupant height (0.6–1.1 m above floor) rather than near heat sources or external walls that might distort readings.
Guidelines for Recommended Temperature Ranges and Their Variability
For desk-oriented activities, I generally aim for temperatures of 21–23°C with relative humidity between 40–60%. This range optimizes both cognitive performance and respiratory comfort. The WELL v2 guidelines emphasize that operative temperature, which considers air temperature and mean radiant temperature, often clarifies why a space may feel warmer or cooler than the readings indicate. Factors like lighting, device use, and solar energy can elevate radiant temperature, misleading occupants into feeling overheated even when air temperature appears normal.
Effective Online Techniques to Implement Right Away
- Smart Thermostat Application: Connect devices from reputable HVAC manufacturers and enable remote monitoring. Ensure proper sensor placement and apply a ±0.5°C calibration if the manufacturer permits it.
- Independent Wi-Fi Sensors: Position these at breathing height, away from direct sunlight, outside walls, and exhaust points. Regularly check battery levels and sync cycles to maintain accurate data.
- HVAC Portal or Building Management System: Numerous systems provide zone temperatures and trends; inspect past 24–72 hours of data to identify patterns before making adjustments.
- Proxy Assessments: In the absence of sensors, utilize occupant feedback forms and juxtapose these with meteorological data and HVAC schedules; while less precise, this method can efficiently highlight potential issues.
Considerations for Sensor Placement, Calibration, and Data Quality
Placing sensors near supply vents often leads to inaccurate low readings, while positioning them near devices or sunlight can yield artificially high temperatures. I leverage a handheld thermometer to validate readings at three locations (desk height, window adjacent, and room center) and calibrate the online sensor to the mean operative value. For multiple zones, clearly label sensors along with notes on their positioning for better future analyses.
Deciphering Readings with Comfort-Influencing Factors
Temperature metrics alone don't ensure comfort. An air speed of 0.1–0.3 m/s can enhance comfort by promoting convective cooling without creating drafts. At relative humidity below 35%, mucosal dryness can increase, while levels above 60% elevate dust mite and mold risks and raise perceived warmth. If your online dashboard encompasses humidity and CO₂ levels, prioritize monitoring those alongside temperature to discern stuffiness from genuine heat.
Impact of Lighting, Radiation, and Perceived Warmth
High-lumen task lighting and direct sunlight can raise mean radiant temperature. If occupants report feeling hot despite normal temperature readings, evaluate blinds, shading, and luminaire heat output. The Illuminating Engineering Society establishes guidelines for glare management and luminance balance; improving glare control and opting for indirect lighting can make the same air temperature feel more comfortable by mitigating radiant hotspots.
Influence of Color and Psychology on Thermal Perception
Warm color schemes (like reds and oranges) can lead occupants to feel a space is warmer, while cooler hues (blues and greens) can subtly encourage thoughts of coolness. Although this doesn’t alter actual temperature, it may affect satisfaction ratings collected online, which is crucial when correlating feedback with sensor data.
Ergonomics and Behavioral Adaptation
Occupants' preferences morph throughout the day: a cool preference in the morning, a warmer tolerance in the afternoon, and heightened sensitivity as fatigue sets in. A flexible strategy with a ±1°C drift along with local air movement options (like task fans) generally yields better outcomes than strict setpoints. Create a user-friendly digital platform for occupants to report hot spots; consolidated feedback can enhance sensor readings.
The Role of Noise, Materials, and Thermal Comfort
Acoustic comfort significantly affects thermal perception. Increased noise can induce stress, raising heat sensitivity. Materials with high thermal mass (such as stone or concrete) stabilize temperature variations but might elevate mean radiant temperature in sunlit areas. Utilizing low-VOC finishes and breathable fabrics can enhance perceived freshness, often associated with cooling sensations.
Considerations for Layout and Zoning
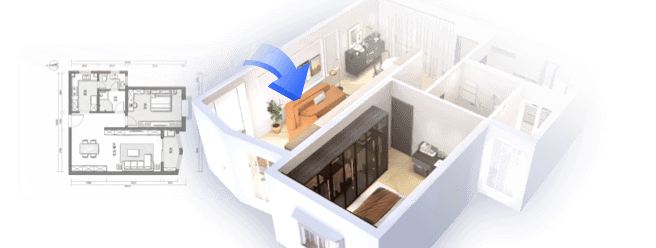
Effective zoning can surpass frequent adjustments. Distinguish perimeter zones from core areas; perimeter zones experience greater solar fluctuations and may require separate setpoints or window sensors. When planning sensor locations or air supply diffuser placements, employing a room layout design tool can facilitate visualization of airflow patterns prior to installation, similar to utilizing Homestyler for layout optimization.
Workflow for Quick Remote Temperature Evaluation
1) Launch your thermostat or sensor application and confirm the last sync time.
2) Analyze the 24-hour trend rather than just the present reading.
3) Cross-check humidity and CO₂ levels if those metrics are available.
4) If the readings appear inaccurate, compare them with a second sensor or recent manual spot checks.
5) Make adjustments to setpoints in increments of ±0.5–1°C and allow 20–30 minutes before reassessing.
6) Document any modifications and occupant feedback to refine the calibration process.
Solutions for Common Issues
- Outdated Data: Change batteries, evaluate Wi-Fi connectivity, and check cloud sync intervals.
- Sensor Calibration Drift: Schedule quarterly calibrations against a reference thermometer.
- Radiant Heat Influence: Consider adding window shades, re-adjusting lighting, or moving sensors away from sunlit areas.
- Mixed Temperature Complaints: Instead of pursuing a single global setpoint, divide zones or introduce local fans.
Frequently Asked Questions
Q1: Is it possible to accurately measure room temperature without a physical sensor?
A1: Estimations can be made based on HVAC schedules and weather conditions, but they lack precision. For reliable online checks, a calibrated Wi-Fi sensor or smart thermostat is recommended.
Q2: What is the recommended temperature for concentrated desk work?
A2: It’s best to aim for around 21–23°C with a relative humidity of 40–60%. The WELL v2 standards support moderate temperatures with controlled humidity levels for optimal cognitive function.
Q3: My app shows 22°C, yet people feel overheated. What should I investigate?
A3: Explore factors affecting mean radiant temperature—sunlight, equipment use, and lighting conditions. Enhance shading, mitigate direct beam light, or incrementally increase airflow.
Q4: How regularly should online sensors undergo calibration?
A4: Quarterly calibrations are practical. Assess against a trustworthy handheld thermometer at various points and apply any offsets supported by the manufacturer.
Q5: Is humidity data necessary in online dashboards?
A5: Absolutely. Variations in relative humidity can significantly impact perceived warmth and respiratory comfort. Maintaining humidity around 40–60% minimizes risks of dryness and mold.
Q6: What’s the optimal location for a single temperature sensor?
A6: Position the sensor at breathing height in a central area, avoiding direct sunlight and proximity to walls or exhausts. It’s vital to steer clear of installation near supply diffusers.
Q7: Do color themes truly influence room temperature perception?
A7: Yes, colors can affect perception. Warm colors may lead occupants to feel warmer, while cool colors can suggest coolness. This understanding is valuable when interpreting feedback alongside sensor data.
Q8: How swiftly should I modify setpoints in response to complaints?
A8: Implement minor changes (±0.5–1°C) and wait for 20–30 minutes. Abrupt significant adjustments can lead to overshooting and discomfort.
Q9: Can increased airflow address most issues without reducing temperature?
A9: Often, yes. Gentle air movement (0.1–0.3 m/s) enhances comfort by boosting convective cooling while maintaining minimal drafts.
Q10: What if certain zones require different temperature settings?
A10: Differentiate between perimeter and core zones by assigning distinct setpoints, and consider additional sensors near windows to efficiently manage solar gain.


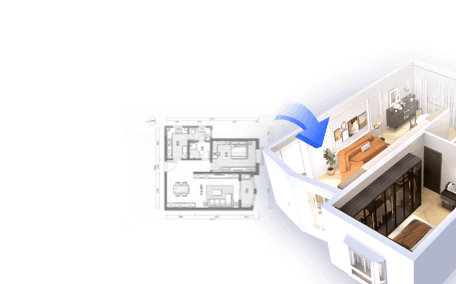
Homestyler is your go-to online home design platform! Experience its user-friendly design tool, stunning 3D renderings, and a wealth of design projects. Plus, dive into DIY video tutorials that empower you to create inspiring spaces with ease. Unlock your creativity today!
Zaprojektuj teraz za darmo